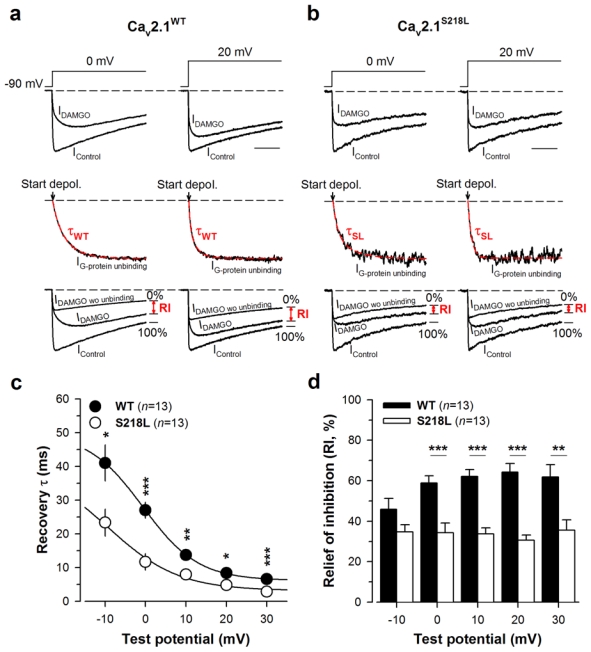
Fig. 3.

The FHM-1 S218L mutation promotes current recovery from G-protein inhibition. a Representative normalized current traces for Cav2.1WT/β4/α2δ-1b channels elicited at 0 and 20 mV before (IControl) and during DAMGO application (IDAMGO) (top panel). Corresponding normalized IG-protein unbinding traces fitted by a mono-exponential decrease (red dashed line) allowing the determination of the time constant τ of current recovery from G-protein inhibition (middle panel). The arrow indicates the start of the depolarisation. Traces that allowed the measurements of RI value (in red) are also shown (bottom panel). b Legend as in (a) but for cells expressing Cav2.1S218L/β4/α2δ-1b channels. c Time constant τ of recovery from G-protein inhibition as a function of membrane potential for Cav2.1WT/β4/α2δ-1b channels (filled circle, n = 13) and Cav2.1S218L/β4/α2δ-1b channels (open circle, n = 13). d Bar chart representation of RI values for Cav2.1WT/β4/α2δ-1b channels (filled bars, n = 13) and Cav2.1S218L/β4/α2δ-1b channels (open bars, n = 13) measured after 200 ms depolarization as a function of membrane potential. Data are presented as mean ± S.E.M for n studied cells. Statistical t test: NS, non significant; *, p ≤ 0.05, **, p ≤ 0.01; ***, p ≤ 0.001.
