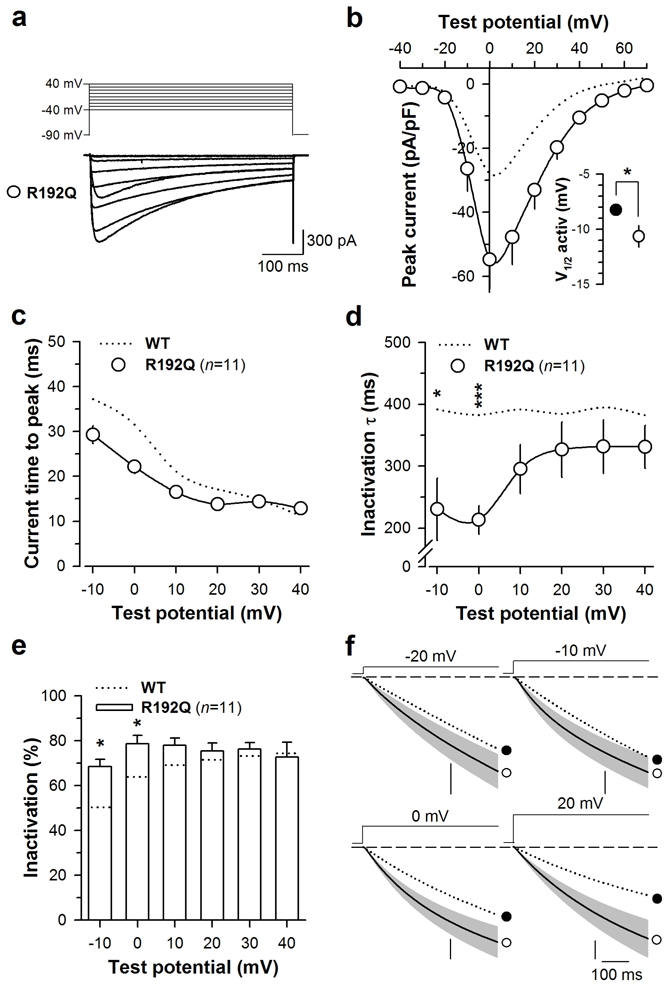
Fig. 4.

Biophysical properties of Cav2.1R192Q mutated channel. a Average set of whole-cell current traces for Cav2.1R192Q/β4/α2δ-1b (n = 11) channel obtained by 500 ms depolarization values ranging between −40 and 40 mV. Holding potential is −90 mV. b Average current voltage relationships for currents measured at their maximal amplitude. Inset: average half-activation potentials for wild-type (filled circles) and mutant (open circles) channels. c Average current time to peak values as a function of test potentials for Cav2.1R192Q mutated channel (n = 11). d Average inactivation time constants of Cav2.1R192Q channels (n = 11) as a function of test potential. The y-axis presents a break point for display purposes. e Average proportion of the inactivating component for Cav2.1R192Q channels (n = 11). f Average integrated whole cell currents for Cav2.1R192Q channels (n = 11) at −20 mV, −10 mV, 0 mV and 20 mV. Vertical scale: 400, 1500, 3000 and 2000 pA. ms. pF−1 respectively. Data are presented as mean ± S.E.M for n studied cells. The dotted line indicates values for the Cav2.1 wild-type channel. Statistical t test: NS, non significant; *, p ≤ 0.05; ***, p ≤ 0.001.
