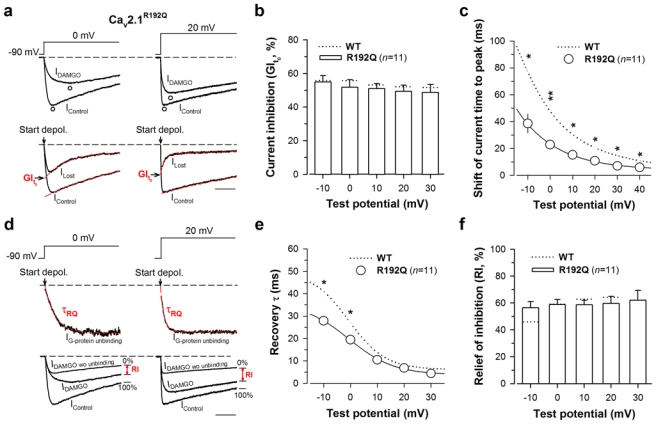
Fig. 5.

The FHM-1 R192Q mutation also promotes recovery from G-protein inhibition. a Representative normalized current traces elicited at 0 mV (left panel) and 20 mV (right panel) before (IControl) and under 10 μM DAMGO application (IDAMGO) for Cav2.1R192Q/β4/α2δ-1b channels (top panel). Corresponding traces allowing the measurement of the maximal DAMGO inhibition at the start of the depolarisation (GIt0) (bottom panel). The arrow indicates the start of the depolarisation. Scale: 50 ms. b Bar chart representation of GIt0 for Cav2.1R192Q/β4/α2δ-1b channels (n = 11) as a function of membrane potential. c Shift of the current time to peak induced by DAMGO application for Cav2.1R192Q/β4/α2δ-1b channels (n = 11) as a function of membrane potential. d Normalized IG-protein unbinding traces at 0 mV (left panel) and 20 mV (right panel) fitted by a mono-exponential decrease (red dashed line) allowing the determination of the time constant τ of current recovery from G-protein inhibition (top panel). The arrow indicates the start of the depolarisation. Traces that allowed the measurements of RI value (in red) are also shown (bottom panel). e Time constant τ of recovery from G-protein inhibition as a function of membrane potential for Cav2.1R192Q/β4/α2δ-1b channels (n = 11). f Bar chart representation of RI values for Cav2.1R192Q/β4/α2δ-1b channels (n = 11) measured after 200 ms depolarization as a function of membrane potential. Data are presented as mean ± S.E.M for n studied cells. The dotted line shows position of values for Cav2.1 wild-type channels. Statistical t test: *, p ≤ 0.05, **, p ≤ 0.01; ***, p ≤ 0.001.
