
Fig. 8. Increases in β1 integrin activity in Icap-1−/− cells.
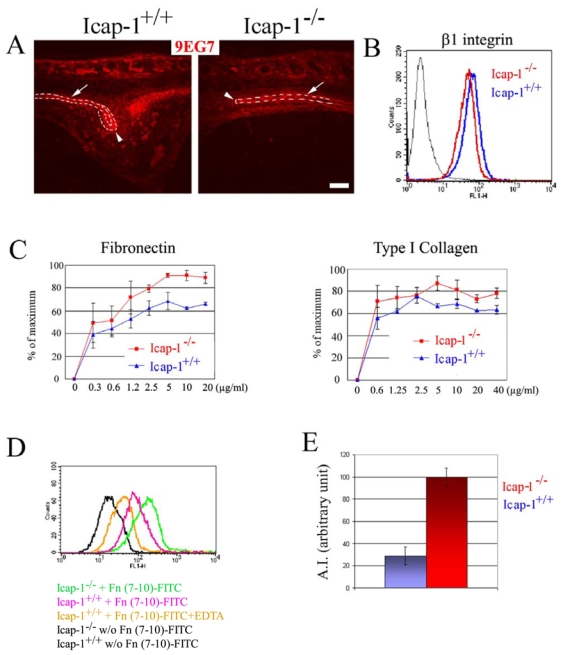
(A) Sagittal sections were stained with the 9EG7 monoclonal antibody (red) that recognizes ligand-bound β1 integrins. β1 integrins are highly expressed and strongly activated on wild-type cells (Icap-1+/+) at the osteogenic front (arrow heads) and at the surface of the bony plates (arrows). In Icap-1−/− tissues, the cells at the osteogenic front show a moderate staining for activated β1 integrin. Bar is 50 μm. (B) FACS analyses demonstrate a slight reduction in the surface expression of β1 integrins (assayed by the MB1.2 monoclonal antibody) on Icap-1−/− primary osteoblasts (red) compared to wild-type osteoblasts (blue). (C) Adhesion assays. The adhesion of Icap-1−/− primary osteoblasts to FN and Col1 is moderately increased compared to Icap-1+/+ cells. Adhesion is expressed as a percentage of the maximal adhesion and measured in duplicate in two independent experiments from two different animals (p<0.05). (D) FACS analysis demonstrates increased binding of FITC-Fn 7–10 fragment to Icap-1−/− osteoblasts (green). (E) The activation index (AI) of the β1 integrin is increased in Icap-1−/− osteoblats. The maximum AI obtained is used to normalize both genotype groups and referred as 100.