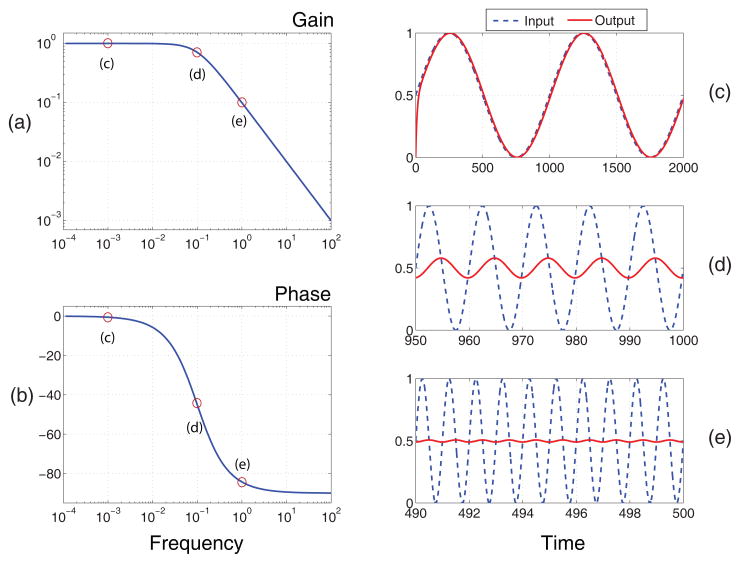
Figure 10.
Low pass frequency response of the simple genetic circuit, Figure 9. The two plots on the left indicate the amplitude and phase response respectively. The three plots on the right show in each case the input signal and corresponding output signal. Each plot on the right was computed at a different frequency, these frequencies are indicated by the marked circles on the plots on the left.

