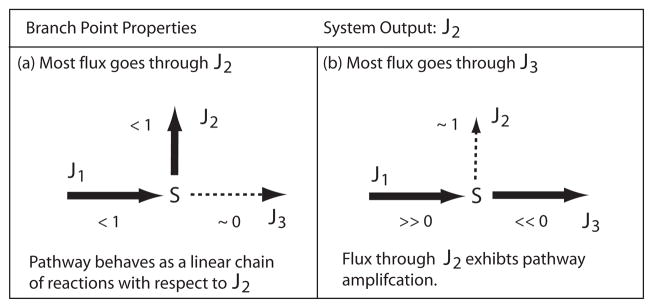
Figure 5.
The figure shows two flux extremes relative to the flux through branch J2. In case (a) where most of the flux goes through J2, the branch reverts functionally to a simple linear sequence of reactions comprised of J1 and J2. In case (b), where most of the flux goes through J3, the flux through J2 now becomes very sensitive to changes in activity at J1 and J3. Given the right kinetic settings, the flux control coefficients can become ‘ultrasensitive’ with values greater than one (less than minus one for activity changes at J3). The values next to each reaction indicates the flux control coefficient for the flux through J2 with respect to activity at the reaction.

