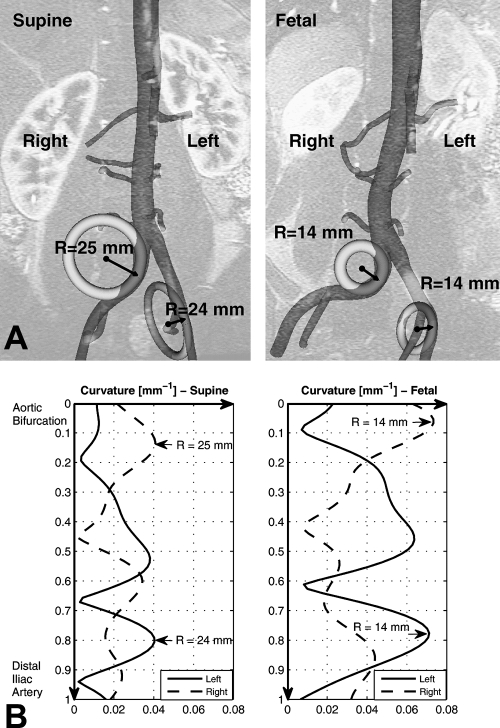
Figure 6.
♦ (A) Circles with radius of curvature at the maximum curvature for the supine and fetal positions are superimposed with geometric models for geometric interpretation. (B) Curvature variation of the iliac artery is plotted along the arc length of the iliac artery from the aortic bifurcation to distal iliac artery. Maximum curvature and corresponding minimum radius of curvature are denoted by arrows.

