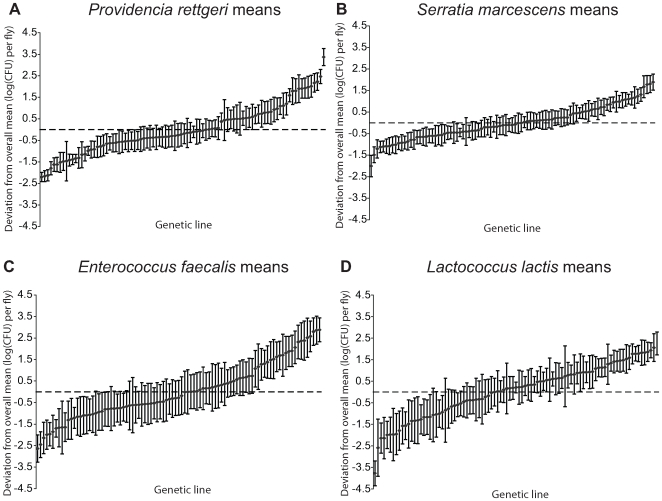
Figure 1. Mean bacterial load sustained 28 hours after infection by each of four different bacteria.
Bacterial load is plotted as the deviation from the overall mean within each bacterium, adjusted for unbalanced data. The genetic lines are plotted independently in ascending rank order for each panel, and are not in the same order across panels. (A) Providencia rettgeri bacterial load. (B) Serratia marcescens bacterial load. (C) Enterococcus faecalis bacterial load. (D) Lactococcus lactis bacterial load.

