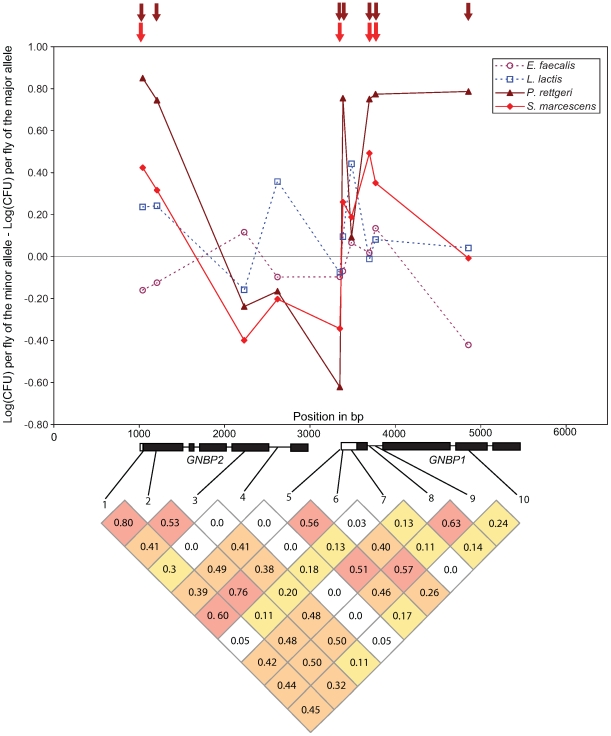
Figure 3. Genotype-phenotype associations at the GNBP locus in chromosomal band 75D.
Upper panel: Plot of the effect size for each of the 10 SNPs genotyped at this locus. Gram-negative bacteria are shown in dashed lines, Gram-positive as solid lines. Arrows above the main graph indicate significance at a nominal α of 0.05. Lower panel: Pattern of linkage disequilibrium among the 10 genotyped SNPs. Grid shows R2 values, shaded by value: >0.50 red, 0.25-0.50 orange, 0.10–0.25 yellow.

