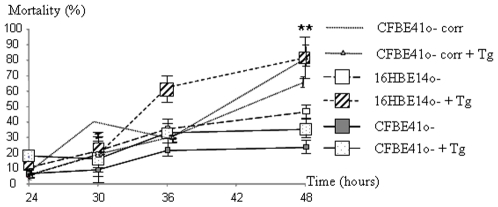
Figure 5. Percentage of mortality in 16HBE14o- and CFBE41o- cells in the presence of Tg.
The curves represent the mortality time course under Tg treatment. In both cell types it was increased with time. Nevertheless, the mortality was higher in 16HBE14o- and CFBE41o- corr cells after 36 hours of Tg treatment (p<0.001). Bars represent SEM (n = 5).

