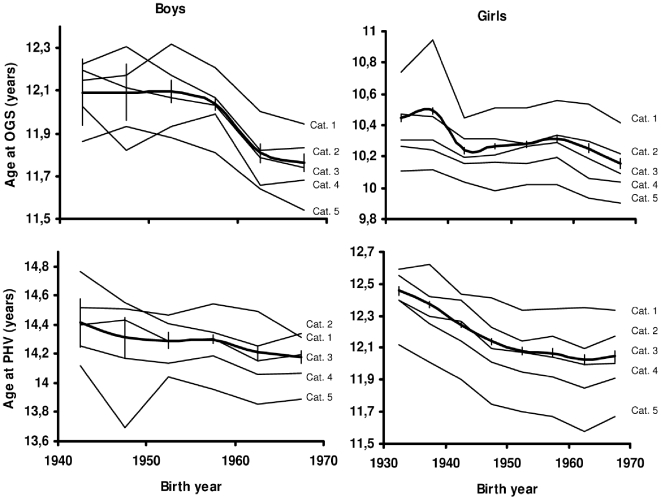
Figure 2. Age at OGS and PHV according to birth year.
Age at OGS (upper panel) and at PHV (lower panel) according to year of birth. Wide lines represent data on the whole cohort including confidence intervals, whereas the slimmer lines represent data on children according to BMI category 1–5. BMI category 1, 2, 3, 4 and 5 = BMI SDS: <−0.75, −0.75 to −0.25, −0.25 to +0.25, +0.25 to +0.75 and >+0.75, respectively. Note data in boys only shown from birth year 1940–69 due to a small number of samples before that time.

