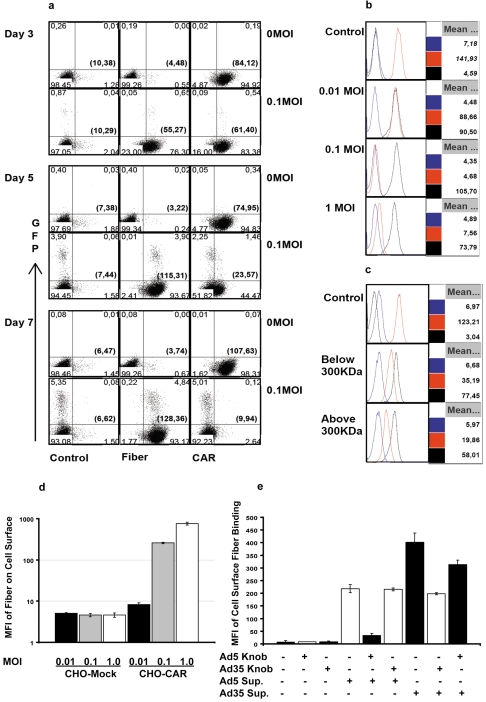
Figure 3. Fiber binding and receptor masking in infected and non-infected cells.
(A) Progressive fiber binding and concomitant decrease in CAR intensity in both infected and non-infected A549 cells were similar following infection with Ad5-CRAD at low MOI. Representative data from 3 independent studies are shown. (B) Supernatants from Ad5-CRAD infected A549 cultures conferred cell surface fiber binding and concomitant decrease in CAR intensity in non-infected A549 cells. Non-infected cells were incubated for 2 hr with A549 culture supernatants harvested at one week post infection with Ad5-CRAD at the indicated MOI, washed and analyzed for CAR and fiber intensity. Data shown are representative histograms of 3 experiments performed at 37°C. The MFIs of isotype control (blue lines), CAR (red lines) and fiber (black lines) staining of all cells are indicated at the right part of each histogram. (C) Free fiber molecules in <300 KDa supernatant fraction from Ad5-CRAD infected A549 cultures conferred the same effect as in (B). Supernatants used in (B) were centrifuged at 108 000 g for 1 hr, fractioned through a membrane with 300 KDa cut-off, and subsequently used in binding experiments as in (B). (D) Supernatants from A549 cell cultures at one week following infection with Ad5-CRAD at the indicated MOIs conferred fiber binding only to CAR expressing CHO cells. The mean ± SD (n = 2) of fiber binding MFI are shown. (E) Supernatant fiber binding to fresh A549 cells was inhibited by recombinant Ad5 or Ad35 fiber knob molecules in a tropism specific manner. The mean ± SD (n = 2) of fiber binding MFI to A549 cells are shown.

