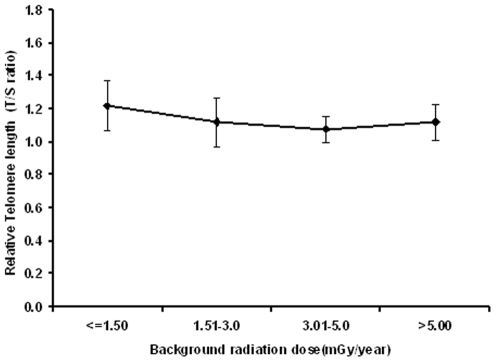
Figure 1. Telomere length in adults with respect to various background dose levels.
(The line graph represents the relative telomere length (T/S ratio) in five different background dose groups (≤1.5, 1.51–3.0, 3.01–5.0, >5.00 mGy/year). For each point, error bars indicate the standard error of the mean (SEM). N (Number of individuals studied in each dose group) is given in table 1).

