FIG. 1.
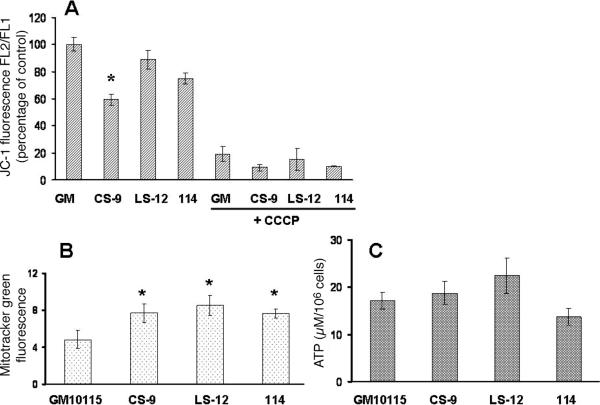
Genomically unstable cells show a depolarized mitochondrial membrane potential, an increase in mitochondrial content and no difference in ATP levels. Panel A: Mitochondrial membrane potential as measured by JC-1. The error bars represent ±1 SD from three independent experiments. * P < 0.05 compared to wild-type cells. Panel B: Mitochondrial content as shown by Mitotracker green staining showed modest differences among clones. Error bars represent ±1 SD from three separate dishes. * P < 0.05 compared to wild-type cells. Panel C: ATP production measured by the luciferase assay. The error bars represent ±1 SD from three separate experiments. ATP levels were not significantly different.

