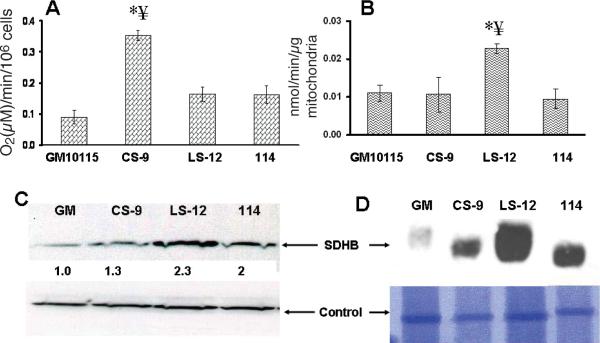
FIG. 2.
Genomically unstable clones show high oxygen consumption and high complex II levels. Panel A: Oxygen consumption. The error bars represent ±1 SD from five independent experiments. CS-9 cells were significantly different from GM10115 cells and stable clone 114. * P < 0.001 compared to wild-type cells, ¥ P < 0.001 compared to 114 cells. Panel B: Complex II activity normalized to mitochondrial protein. * P < 0.05 compared to wild-type cells, ¥ P < 0.05 compared to 114 cells. Panel C: Western blots of whole cell lysate using 100 μg protein and SDHB antibody. Quantification shown by numerical data was achieved by normalizing SDHB density to actin density. Panel D: Coomassie blue staining of a Blue Native gel (lower panel) and a Western blot of a parallel gel probed with SDHB antibody.

