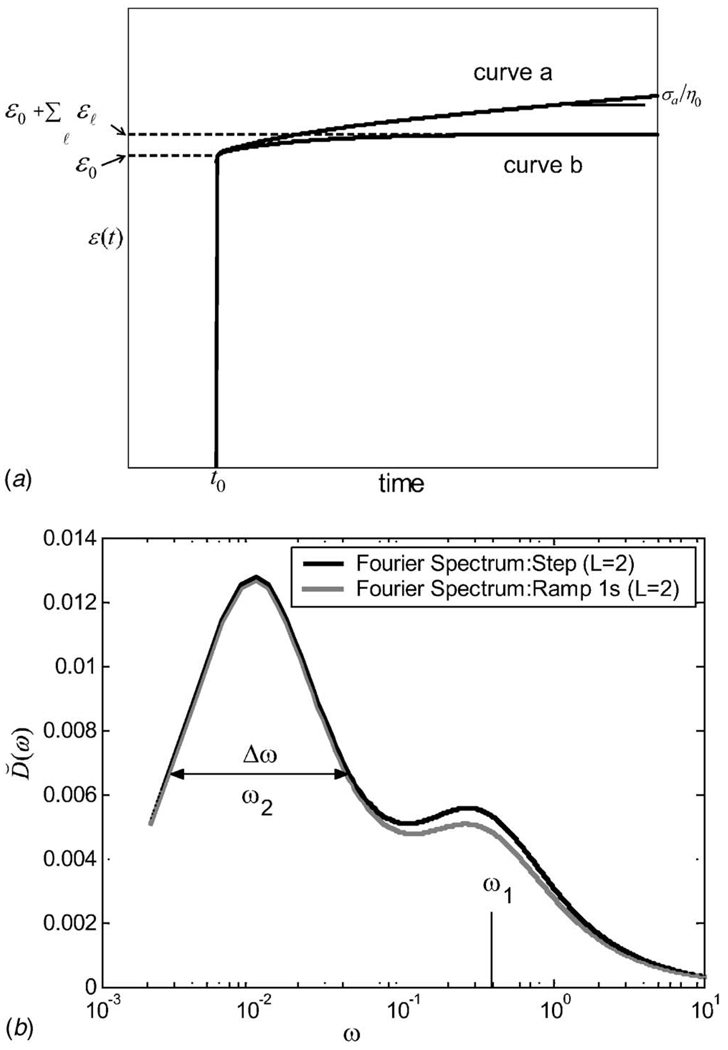
Fig. 1.
(a) Creep curves for a second-order (L=2) Voigt model and a step stress stimulus are illustrated. Curve a is drawn directly from Eq. (8) with finite η0; its slope at t ≫ T2 is σa/η0. Curve b is from the same equation where η0=∞. In both cases, ϵ2/ϵ1 = 2.5, T1=3 s, and T2=100 s. (b) The corresponding Fourier spectra D̆(ω) are from Eq. (10). Spectra from a step and 1 s ramp stress stimulus are compared.

