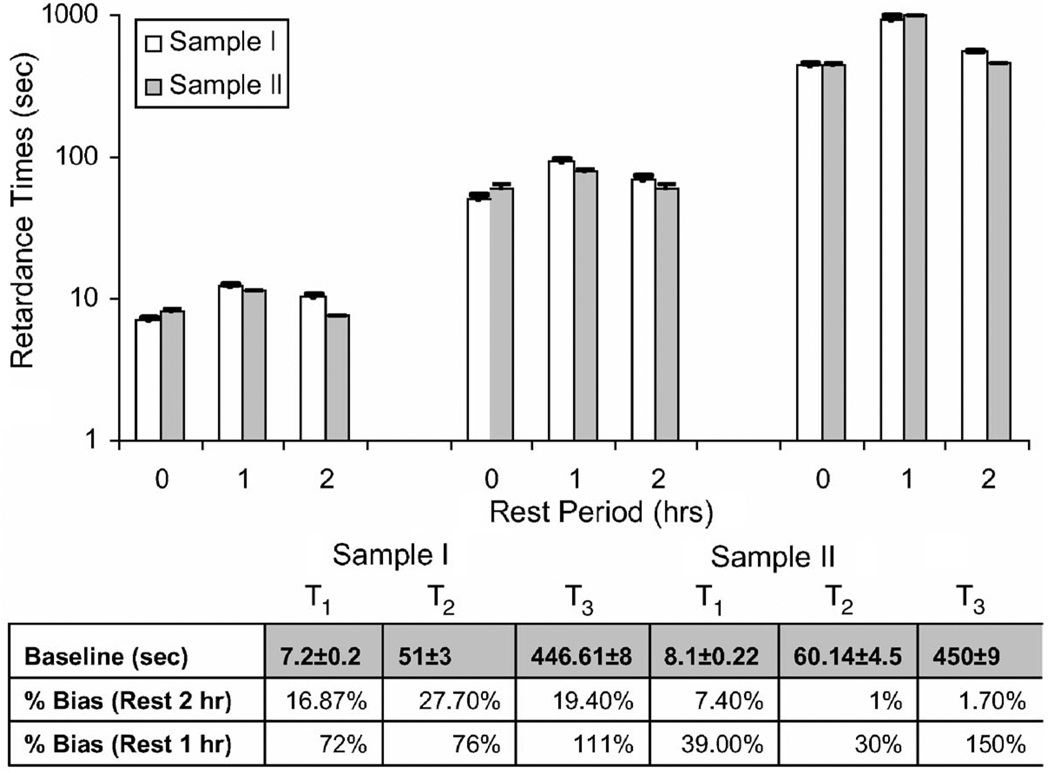
Fig. 13.
Effects of rest time on viscoelastic estimates. Top: Variation of T1 (left group), T2 (middle group), and T3 (right group) for a third-order Voigt model are shown for baseline measurements (0) and rest times of 1 and 2 h. Error bars indicate fitting uncertainties. Bottom: Table showing initial baseline retardance times in seconds and percent biases for rest times of 1 or 2 h between measurements.

