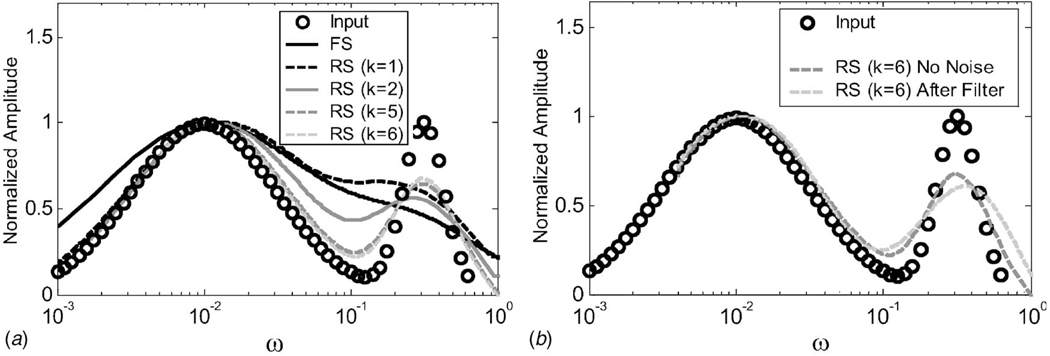
Fig. 2.
(a) Retardation spectra from simulated data. Plotted are L̃(ω)=L(τ)|τ=1/ω for comparison with the Fourier spectrum. Creep data were generated from Eq. (12) for ϵ0=σa/η0 = 0 assuming a broadband, bimodal input as given by the circle points (Input). Estimated retardation spectra (RS) L(k)(ω) for k=1,2,5,6, are compared to the Fourier spectrum (FS) D̆(ω), computed from the same data. (b) L̃(6) estimates without noise in the creep data and with noise (signal-to-noise ratio=32.2 dB). A ninth-order polynomial filter was applied to the noisy data before estimation.

