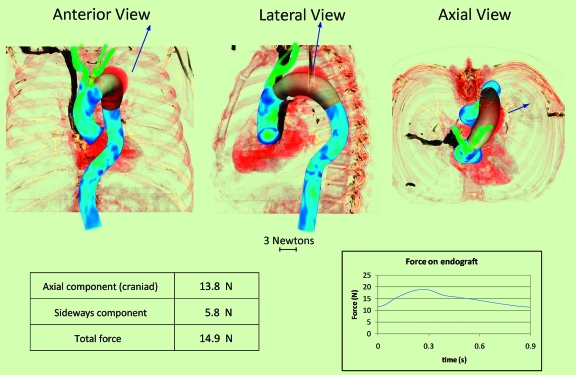
Figure 4.
♦ Proximal descending thoracic aortic endograft in anterior, lateral, and axial views showing the vector (arrow) of the displacement force (DF). Mean value of the DF vector, its sideways and axial components, and temporal variation over the cardiac cycle are given below. Note that the axial DF vector is in the cranial rather than the caudal direction. The displacement force magnitude changes over the cardiac cycle, varying from 11.5 N in diastole to 18.9 N at peak systole

