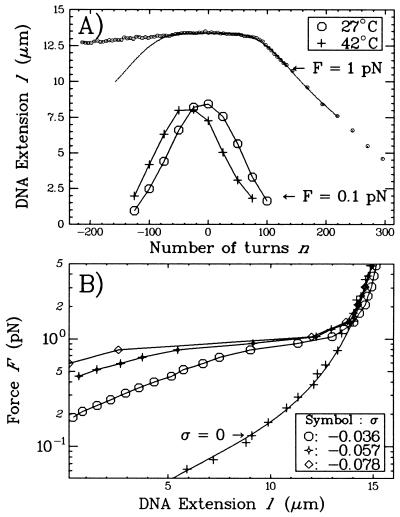
Figure 3.
(A) Extension vs. supercoiling curves for a single DNA molecule in the standard solution. The DNA measured 16 μm as determined by a worm-like chain fit (21, 22) to its torsion-free force vs. extension curve (data not shown). The low force curve (F = 0.1 pN) obtained at 42°C is translated by −27 turns relative to the one obtained at 27°C. The high force curve (F = 1 pN and T = 27°C) is interesting in that the molecule contracts differently for n > 0 than for n < 0. In particular, the symmetry between overwinding and underwinding is broken at about nc ≈ −70 turns (where the experimental curve separates from the symmetrical continuous curve, obtained by reflecting the data for σ > 0 about σ = 0). (B) Force vs. extension curves obtained at 27°C. The σ = 0 data set was fit by the worm-like chain model with L = 16 μm and ξ = 45 nm. Note that the rigidity of the molecule is a sensitive function of the degree of supercoiling. In these conditions, the molecule undergoes an abrupt transition to an extended state at the critical force Fc ≈ 1 pN.

