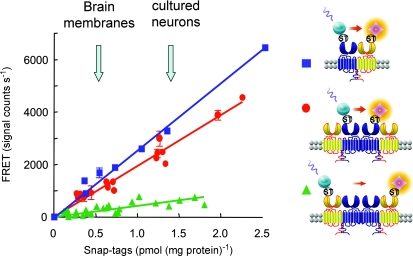
Figure 4. GABAB receptors organize into larger complexes.
GABAB1 (blue), GABAB2 (yellow) or both subunits were fused to a snap-tag (ST) at their N-termini, expressed at various densities in transfected cells, and labelled with benzylguanine derivatives carrying either Eu-crytate (TR-FRET donor) or d2-crytate (TR-FRET acceptor). The TR-FRET measurements revealed a close proximity between GABAB1 and GABAB2 subunits, but also a similar FRET between two GABAB1 subunits. In contrast, very low FRET was measured between two GABAB2 subunits. Note that the FRET emission is proportional to the amount of receptors at the cell surface (represented here as the amount of ST that can be labelled on intact cells) and is clearly detectable for densities similar to those reported in brain membranes or in cultured cortical neurons (arrows in the graph). In the graph, TR-FRET efficacy is represented by the slope of the curve and is then constant over the receptor densities analysed. Adapted from Maurel et al. (2008).

