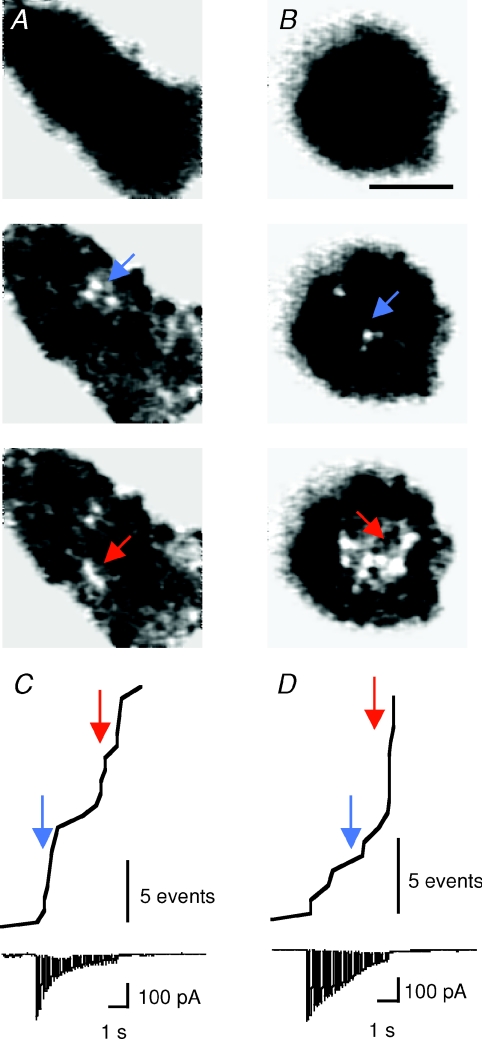
Figure 1. Bursts of fusion events occurring in clusters on the membrane.
A and B, background-subtracted IRM images from 2 different cells stimulated with a train of 24 × 105 ms depolarizations at 5 Hz. Before stimulation, IRM footprints were uniformly dark (top row), but discrete spots appear on depolarization. A was recorded with 1.5 mm EGTA in the patch pipette and B with 5 mm EGTA. Image in B comes from Supplemental Movie 1, available online only. Scale bar, 5 μm. C and D, the cumulative number of fusion events and the corresponding whole-cell Ca2+ currents plotted for cells in A and B. Coloured arrows correspond to time points at which the frames shown in A and B were extracted. Note the slower inactivation of Ca2+ currents in D compared to C. Scale bar, 5 fusion events.

