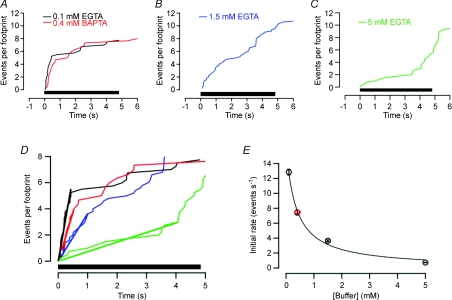
Figure 2. EGTA increased the delay between the beginning of stimulation and the first burst of exocytosis.
A–C, cumulative plot of number of fusion events per footprint observed during trains of 24 × 105 ms depolarizations delivered at 5 Hz. Cells were dialysed with 0.1 mm EGTA (A; n= 4), 1.5 mm EGTA (B; n= 5), 5 mm EGTA (C; n= 4) or 0.4 mm BAPTA (A; n= 3). D, the traces in A–C superimposed on an expanded time scale. The initial phases of release have been fitted with straight lines through the origin (bold). E, the initial rate of fusion events (per second per footprint) as a function of the concentration of EGTA or BAPTA in the patch pipette. The line through the points is the least-squares fit of the relation R=Rmax[1 − (E/(E+E1/2))], where E is the concentration of buffer in mm, E1/2 is the concentration where inhibition is half-maximal (0.36 mm) and Rmax is the maximum rate of release in the absence of any calcium buffer in the patch pipette (16 events per second per footprint). Both Rmax and E1/2 were free parameters in the fitting process. The red point is a measurement in BAPTA and the black points are measurements in EGTA. Error bars show the standard deviation of the linear fits in D (some of these are narrower than the points).

