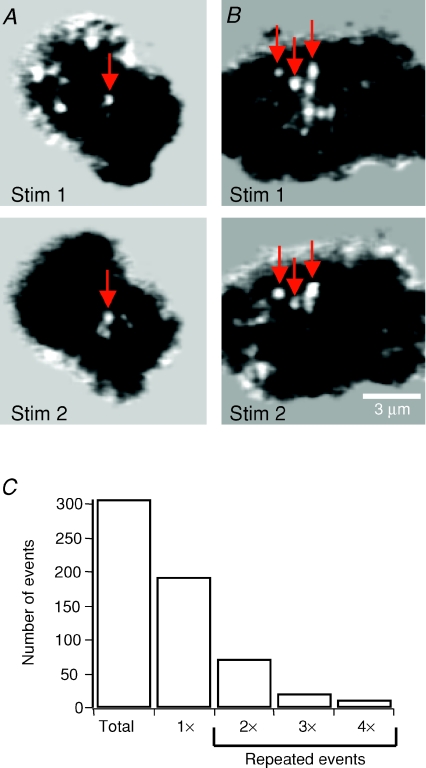
Figure 3. Specialized sites of fusion.
A and B, background-subtracted images from the IRM movies of two cells, each stimulated twice (Stim 1 and Stim 2). Arrows are located in the same position during the first and second stimulations, indicating fusion events occurring in the same spot. Stim 1 and Stim 2 images in B are from Supplemental Movie 2 (available online only). C, histogram showing the number of fusion events that occurred within the same spots two, three, or four times, from a total of 307 events. The bar marked ‘1×’ is the number of events that did not overlap with any others.

