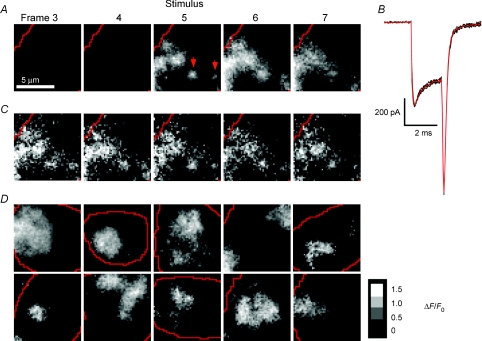
Figure 4. Visualizing sites of calcium influx by TIRFM.
A, images showing the relative change in fluorescence (ΔF/F) of OGBAPTA-2 (0.1 mm) in the footprint of a chromaffin cell. Averaged from six movies of 7 × 11 ms frames acquired at 10 s intervals, all from the same cell. Calcium influx was triggered by a 2 ms depolarization (−80 to +10mV) delivered at the beginning of frame 5; a 1 ms prepulse from −80 mV to +150 mV was delivered immediately preceding the 2 ms depolarization. Red lines indicate the edges of the footprint. B, whole-cell Ca2+ currents recorded for each of the 6 stimuli delivered to the cell in A (black traces) and the average of the 6 traces (red). C, five individual examples of the stimulus frames used to make the averaged frame 5 in A. D, a gallery of averaged stimulus frames showing the relative change in intensity (ΔI/I0) from 10 different cells on a grey scale. Each image is the average of 6 or 8 stimulus frames. Scale bar in arbitrary units shows ΔI/I0.

