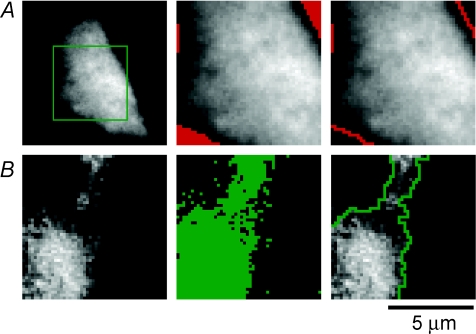
Figure 5. Defining the area of the footprint and calcium patches.
A, defining the area of the footprint. TIRFM image of a voltage-clamped chromaffin cell, at rest, loaded with 0.1 mm OGBAPTA-2. To acquire TIRFM images at 11 ms per frame, data collection was restricted to a 50 pixels × 50 pixels ROI (green box, left). To define the outline of the footprint, we determined the minimum (MINframe1) and maximum (MAXframe1) pixel intensities for the first frame in a movie. A threshold was then set at the minimum pixel intensity (MINframe1) + 20% of the total intensity range (MAXframe1) – (MINframe1). All pixels below the threshold are marked in red (middle), and the margins of these regions are shown by the lines in image at right. B, defining the area of calcium influx. An image of the relative change in the fluorescence of OGBAPTA-2 (ΔF/F) in the frame in which Ca2+ influx was activated for 2 ms is shown at left. This image was thresholded by first determining the maximum pixel intensity over all the prestimulus frames (MAXframe1-4) and the maximum pixel intensity of the stimulus frame (MAXframe5). The minimum threshold was set as (MAXframe1-4) + 20% of the intensity range (MAXframe5) – (MAXframe1-4). The pixels above this threshold are marked in green in the middle panel and the margins of this area are shown by the green line in the right panel.

