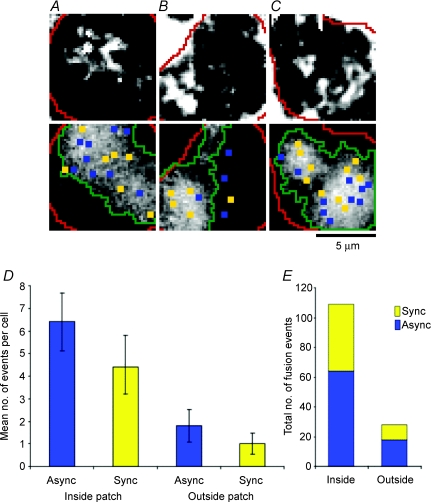
Figure 6. Fusion events occurred preferentially close to calcium channels.
IRM images averaged over a 12 s period from the start of the stimulus are shown in the top row and areas of Ca2+ influx visualized by TIRFM are shown below for three different cells (A–C). To trigger the fusion events (A–C, top), cells were voltage clamped in the perforated-patch configuration and stimulated with 4 × 90 ms depolarizations at 5 Hz. We then broke-through to whole-cell configuration and loaded cells with 0.1 mm OGBAPTA-2. The TIRFM images of Ca2+ influx (A–C, bottom) show the average stimulus frames (ΔF/F), as in Fig. 4D. Overlaid onto the TIRFM images are the sites of synchronous (yellow) and asynchronous (blue) fusion events visualized by IRM, the outline of the footprints (red lines), and the perimeter of the Ca2+ channel patches (green lines). D, average number, per cell, of asynchronous and synchronous fusion events occurring inside vs. outside of calcium channel patches. The differences between the means for asynchronous events inside vs. outside were significantly different (t test, P= 0.006), as were the differences between the means for synchronous events inside vs. outside (P= 0.03). Error bars are s.e.m.; n= 10 cells for each. E, total number of fusion events recorded for 10 cells (137 total events) is broken down to reveal the ratio of synchronous to asynchronous, inside and outside of the calcium channel patches.

