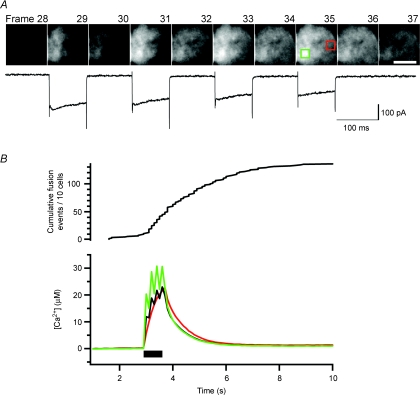
Figure 7. Visualizing calcium influx with a low affinity calcium indicator.
A, ten consecutive frames showing ΔF/F from a cell loaded with 0.2 mm Fluo-5N through the patch pipette. The whole-cell Ca2+ current is shown below. The four 90 ms depolarization steps occurred within frames 29, 31, 33 and 35 (100 ms per frame). Scale bar: 5 μm. B, the submembranous [Ca2+] averaged over the whole footprint (black) for the same cell shown in A was compared with the [Ca2+] of two ROIs (each 10 pixels × 10 pixels), one ROI centred over a patch of Ca2+ channels (green box in A) and one remote from Ca2+ channels (red box). The black bar indicates the time of the depolarization. Similar results were seen for seven other cells. The cumulative exocytosis events measured by IRM in response to the same stimulus is shown above (n= 10 cells).

