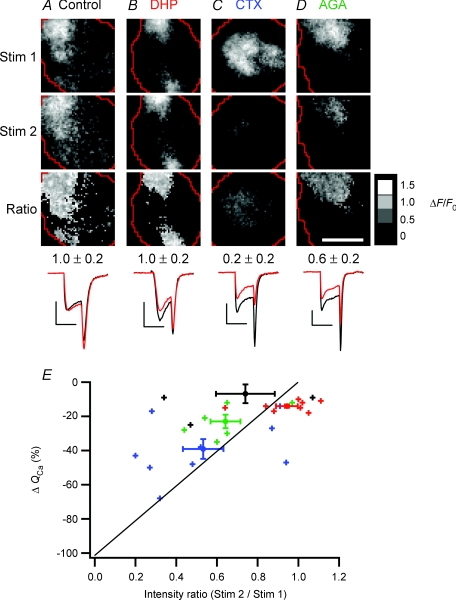
Figure 8. Calcium channel patches in footprints consist primarily of N- and P/Q-type channels.
A–D, images of Ca2+ influx (ΔF/F) obtained at rest (Stim 1, top row) and in a test condition (Stim 2, second row), as well as the ratio of Stim 2/Stim 1 (Ratio, third row). Each frame is averaged from 6 responses to depolarizations lasting 2 ms. Before and during the second stimulus set (Stim 2), cells were perfused either with normal Ringer solution (A), 20 μm nifedipine and 20 μm nimodipine (B), 1 μmω-conotoxin GVIA (C) or 200–400 nmω-agatoxin IVA (D). Mean ratio values (±s.d.) over the patch of Ca2+ channels are shown below the ratio images. The averaged whole-cell Ca2+ currents for Stim 1 (black) and Stim 2 (red) are at bottom; all calibration bars: 200 pA × 2 ms. Scale bar: 5 μm; ratio calibration bar = 1.5 (white), 1.0, 0.5, 0 (black). E, collected results (n= 28 cells), showing the percentage change in Ca2+ influx over the whole cell (ΔQCa) versus the intensity ratio over the patch of Ca2+ channels. Small crosses represent data from individual cells perfused with either control Ringer solution (black), dihydropyridines (red), conotoxin (blue), or agatoxin (green) before collecting the second set of stimulus images. Large markers with error bars represent means. The diagonal line marks the relationship expected if ΔF/F were directly proportional to QCa and all types of Ca2+ channels were randomly distributed over the whole surface of the cell, including the footprint.

