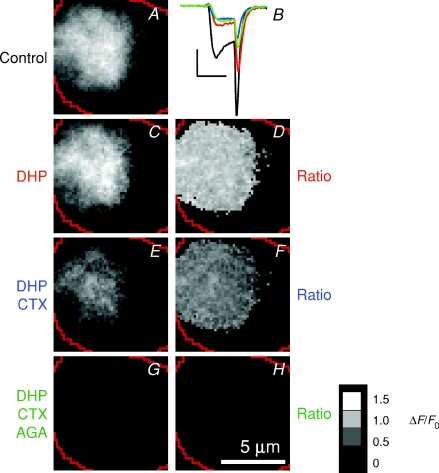
Figure 9. Absence of L-type calcium channels in the footprint.
A, images of Ca2+ influx (ΔF/F) obtained at rest, then after successively adding 20 μm nifedipine and 20 μm nimodipine (C), 1 μmω-conotoxin GVIA (E) and 200–400 nmω-agatoxin IVA (G), all to the same cell. The corresponding ratio images are shown in D, F and H; the Ca2+ currents are shown in B. Dihydropyridines blocked the majority of Ca2+ channels in the surface membrane of this cell as a whole (B), but none in the footprint (D). Calibration bar in B: 200 pA × 2 ms; scale bar, 5 μm; ratio calibration bar = 1.5 (white), 1.0, 0.5, 0 (black).

