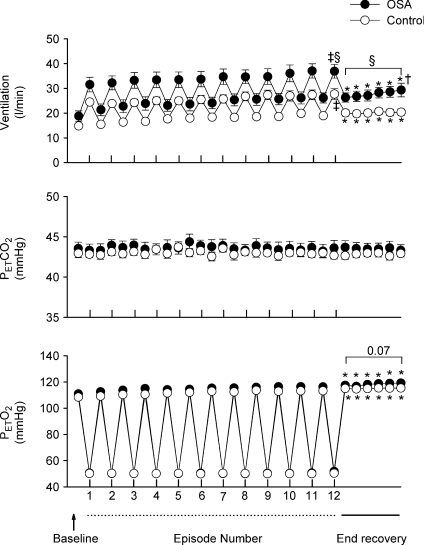
Figure 1. Measures of minute ventilation before, during and following intermittent hypoxia in OSA and control participants after administration of the placebo cocktail.
Average values for minute ventilation, end-tidal carbon dioxide partial pressure ( ) and end-tidal oxygen partial pressure (
 ) recorded from the last 5 min of baseline, the last 2 min of each episode of hypoxia (indicated by division marks on the x-axis), the last 2 min of each normoxic period that separated the hypoxic episodes, and the 30 min post-stimuli recovery period which is divided into six 5-min segments. The data were collected following administration of the placebo cocktail in the OSA (filled circles) and healthy (open circles) participants. Note that a progressive increase in minute ventilation occurred during exposure to intermittent hypoxia and that an elevated level of ventilation was sustained during end-recovery compared to baseline in both groups. However, notice that minute ventilation during the last hypoxic episode and end-recovery was greater in OSA participants compared to control. Lastly, note that the increased minute ventilation during end-recovery compared to baseline in both groups was accompanied by an increase in
  which tended to be greater in the OSA participants compared to control. ‡Significantly different from the initial hypoxic episode; *significantly different from baseline; §significantly different from control; †significantly different from the initial 5 min end-recovery segment.

