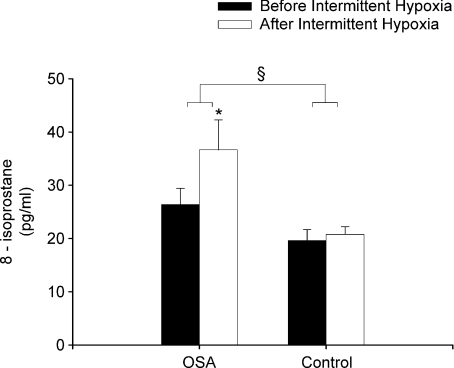
Figure 5. Measures of 8-isoprostane obtained from OSA and control participants before and after intermittent hypoxia during the placebo trial.
Bar graphs showing average measures of 8-isoprostane obtained from the OSA and control participants before and after intermittent hypoxia during the placebo trial. Note that 8-isoprostane measures increased in the OSA participants but not in the control participants after (open bars) compared to before (filled bars) intermittent hypoxia. Additionally, note that the measures of 8-isoprostane were greater in the OSA compared to the control participants both before and after intermittent hypoxia. *Significantly different from before intermittent hypoxia; §significantly different from control.

