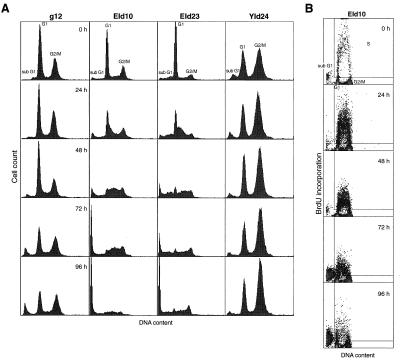
Figure 5.
Flow-cytometric analysis of cells expressing E1A12S, and/or Id-1H and Id-2H. (A) After treatment of cells with dex, DNA contents were examined by PI staining and flow cytometry. The cells with a DNA content less than that of G1 cells are shown by sub-G1. (B) Sparse cultures of EId10 cells were treated with dex and incubated with 100 μM BrdU for 2 h before fixation. The cells synthesizing DNA, estimated by incorporation of BrdU, are shown in the insets and the populations of cells in G1, G2/M and sub-G1 population are shown outside the insets.

