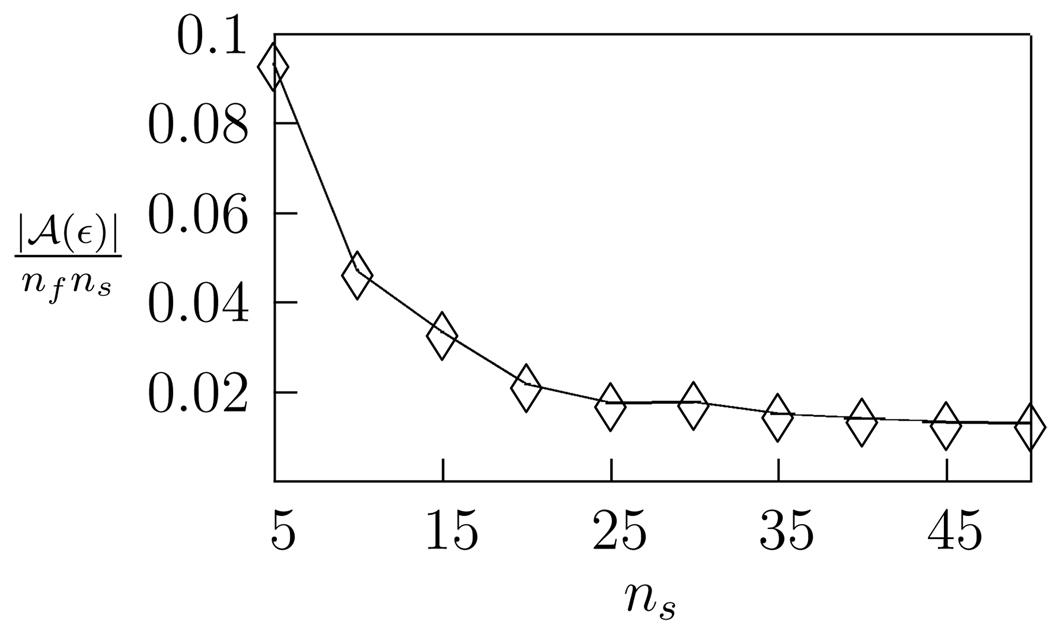
Figure 4.
Proportion of dimensions above tolerance as a function of sample width (ε = 0.004). Longer samples contain a higher degree of temporal correlation, and so have proportionally fewer high variance dimensions. Here |𝒜(ε)| is the number of significant dimensions, and nfns is the total number of dimensions in the stimulus space.

