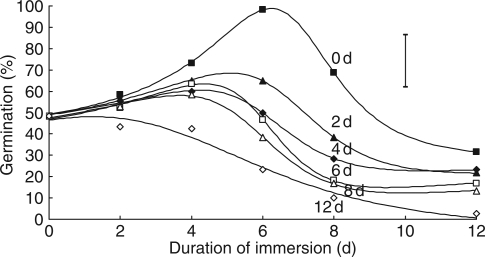
Fig. 6.
Effect of different durations of immersion (x-axis) followed by a range of durations of desiccation (0, 2, 4, 6, 8 or 12 d, as indicated) on seed germination of R. raphanistrum. Symbols are observed values. The error bar is the s.e. for comparison of any two observations for a given duration of immersion. Fitted curves are described in the text.

