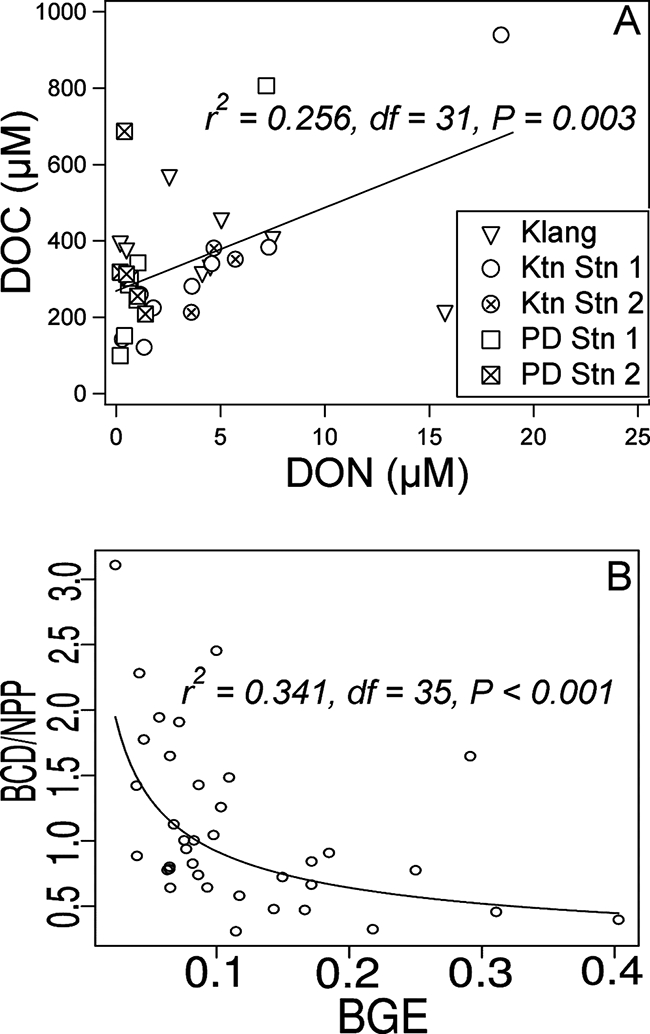
FIG. 6.

(A) Correlation analysis between DOC (μM) and DON (μM). Outliers (DOC of >1,000 μM and DON of >25 μM) are not shown and are not included in the correlation analysis. (B) Correlation analysis between BCD/NPP and BGE. Regression slopes are also shown.
