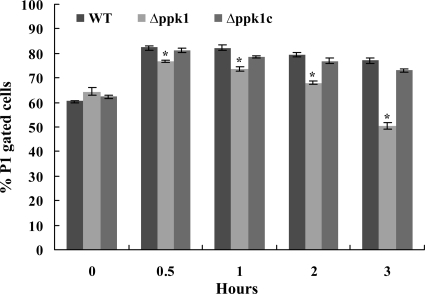
FIG. 3.
Two-parameter FSC/SSC flow cytometry analysis of C. jejuni strains with and without formic acid treatment. FSC represents cell size, while reverse scatter is for cell granularity. A gate (P1) was set on FSC versus SSC to select the cell population for determining the change in cell size/granularity. The percent changes in P1-gated cells of the wild-type and Δppk1 and Δppk1c mutant strains at different time points after formic acid treatment are shown. The bars represent the mean ± SE of two independent experiments. *, P < 0.01. WT, wild type.

