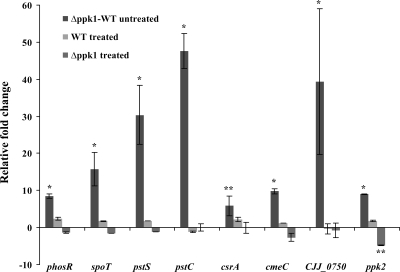
FIG. 5.
Histogram showing the relative change in the expression of target genes before and after formic acid treatment. The relative change (2−ΔΔCT) in gene expression was calculated from the ΔΔCT value after normalization. Δppk1-WT (wild type) untreated indicates the fold change in gene expression of the Δppk1 mutant strain relative to the wild-type strain. WT treated indicates the fold change in gene expression in the wild-type strain treated with formic acid relative to the untreated wild type. Δppk1 treated indicates the relative fold change in gene expression of the Δppk1 mutant treated with formic acid relative to the untreated Δppk1 mutant. Genes with a twofold or greater (P < 0.01 or 0.05) relative change in expression were considered upregulated or downregulated. Each bar represents the mean ± SE of the relative fold change in expression from three independent experiments with triplicate reactions for each sample. *, P < 0.01; **, P < 0.05.

