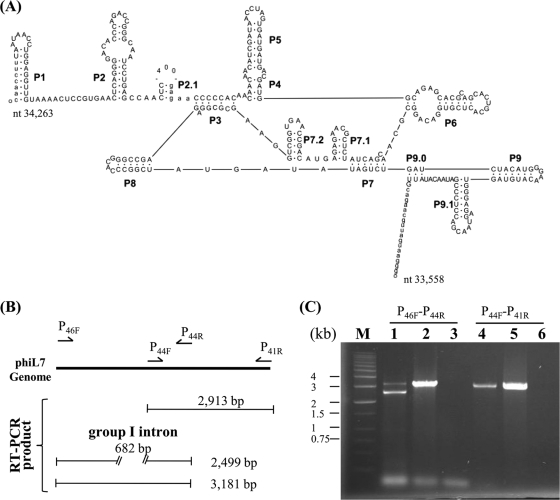
FIG. 4.
Group I intron (subgroup IA2) in the predicted phiL7 DNA polymerase I gene and assay for the splicing. (A) Secondary structure of the intron. Exon and intron sequences are in lowercase and uppercase letters, respectively, and boundaries indicate the splicing sites. The vertical arrow indicates the 400-bp loop, which contains the first 375 bp of the HNH endonuclease gene p45 plus 25 bp from the upstream region. (B) Diagrammatic representation depicting the RT-PCR fragments that would be obtained using different primer pairs. Using primers P46F and P44R, products of 3,181 and 2,499 bp, representing nonprocessed and processed RNA, respectively, would be obtained. As a control, using primers P44F and P41R for amplification of the cDNA region encompassing p44 to p41, which had identical sequence to the genomic DNA, would yield a single product of 2,913 bp. (C) Agarose gel electrophoresis of the PCR fragments obtained from the splicing assays. PCRs were performed as described in Materials and Methods, and the PCR products were subjected to agarose gel (0.7%) electrophoresis. The primers used are labeled above the lanes. Lane M contains DNA size markers. The templates used were cDNA (lanes 1 and 4), phiL7 genome DNA (lanes 2 and 5), and RNA isolated from phiL7-infected X. campestris pv. campestris strain 17 (lanes 3 and 6). The 2,499- and 3,181-bp fragments in lane 1 represent processed and nonprocessed products, respectively. The 3,181-bp fragment can be seen in lane 2, while the 2,913-bp fragment is visualized in lanes 4 and 5.

