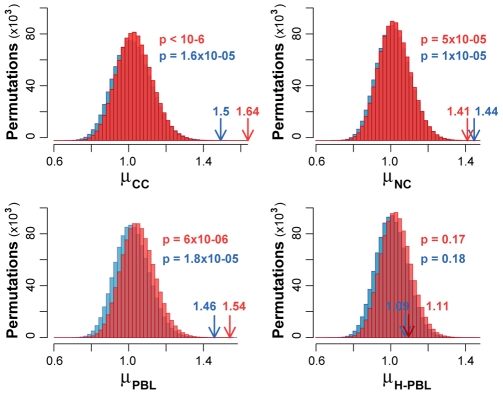
Figure 3. Observed and expected mutability outside and inside UCR41.
Observed values of mutability ratios (arrows) were compared to the expected distributions computed from 1,000,000 random permutations of the raw data (red) and after removing all potential errors (blue). p represents the probability of obtaining the observed mutability ratio by chance and was calculated as the fraction of the expected ratios equal or higher than the observed value.

