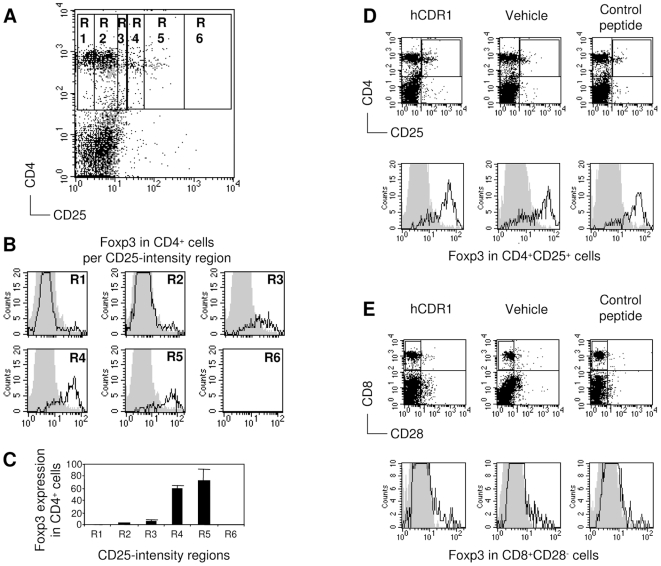
Figure 1. Plot settings for analyzing CD4 and CD8 Tregs by flow cytometry.
Percentages of CD4+CD25+Foxp3+ cells (i.e. CD4 Tregs) and CD8+CD28−Foxp3+ cells in spleens from individual healthy BALB/c mice were determined at different time points over a period of 16 days following a single subcutaneous injection of either a tolerogenic peptide (hCDR1), a control peptide or vehicle alone. Spleen-derived cells were triple-stained with CD4, CD25 and Foxp3 and analyzed by flow cytometry. Shown are representative results obtained on day 9 following the injection. (A) The gate of CD4+ cells was subdivided for 6 regions corresponding to different intensities of staining with CD25. (B) The expression of Foxp3 was determined in the different regions. Gray contours indicate staining with the isotype control. (C) Foxp3 relative expression in CD4+ cells per intensity region of CD25 staining. Accordingly, cutting borders that summate regions R4, R5, and R6 of CD25 intensity should properly indicate regulatory phenotype based on Foxp3 staining.(A, B, C) present results with cells of mice injected with hCDR1 only. (D) Representative dot plots of CD4 and CD25-expressing spleen-derived cells and histograms of Foxp3 expression in the CD4+CD25+ cells from the 3 treatment groups. (E) Representative dot plots of CD8 and CD28-expressing spleen-derived cells and histograms of Foxp3 expression in the CD8+CD28− cells from the 3 treatment groups.

