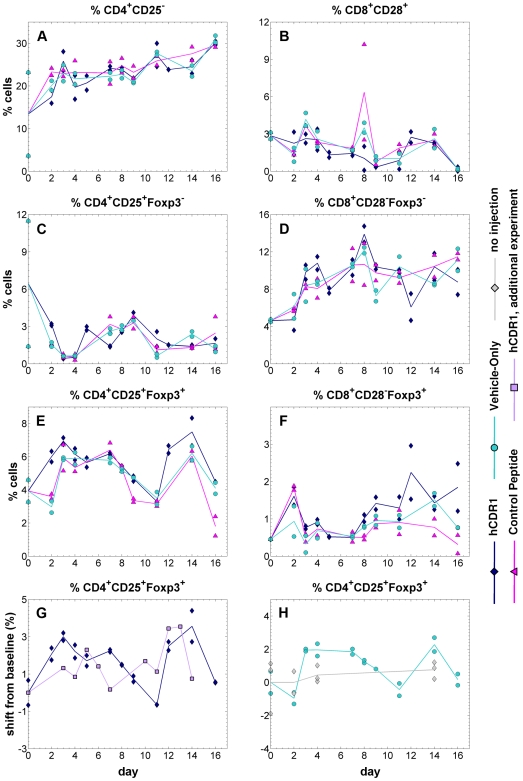
Figure 2. The kinetics of spleen-derived T cell subsets.
Healthy BALB/c mice received a single injection of one of three alternative treatments (hCDR1, vehicle-only, control peptide). In each inspected day, 2 mice were sacrificed out of each treatment group, and the percentage of cells bearing the markers CD4, CD8, CD25, CD28 and Foxp3 was determined using flow cytometry. Points represent measured values, lines connect the daily averages. Presented cell subpopulations: (A) CD4+CD25− (B) CD8+CD28+ (C) CD4+CD25+Foxp3− (D) CD8+CD28−Foxp3− (E) CD4+CD25+Foxp3+ (F) CD8+CD28−Foxp3+. Panel (G) compares the kinetics of CD4+CD25+Foxp3+ cells in two different experiments, following injection of hCDR1. Panel (H) presents measurements of CD4+CD25+Foxp3+ cells, taken from mice which received no injection, as compared to mice injected with vehicle alone. Note that both in panel (G) and panel (H), the reported data are absolute shifts from the baseline (i.e. day 0 measurements), to enable comparison over different experiments.

