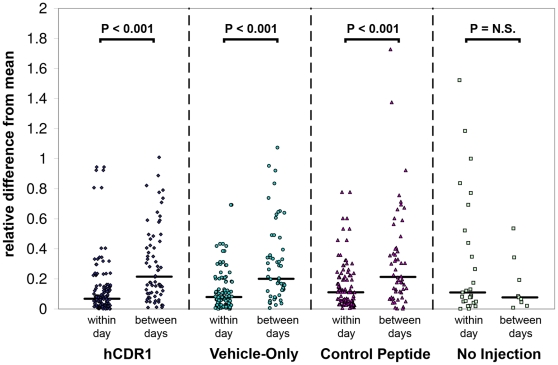
Figure 3. A comparison of the within-day and between-days variations for the different groups.
The within-day variation was computed as the difference between each FACS measurement and its corresponding daily average (i.e. the average of the 2 measurements taken for the relevant day, cell subset and treatment group), divided by this average. The between-days variation was computed as the difference between each daily average and the overall average of the series (i.e., the average of all the measurements related to a cell subset and treatment group), divided by the overall average. The division by averages serves as a normalization step, allowing to compare all cell subsets together. Horizontal lines represent the medians. The statistical significance of the differences between the within-day and between-days variations was estimated using the non-parametric Mann-Whitney U-test, resulting with P<0.001 for each of the 3 treatment groups. For the non-injected mice, the difference between the within-day and between-days variations was not statistically significant.

