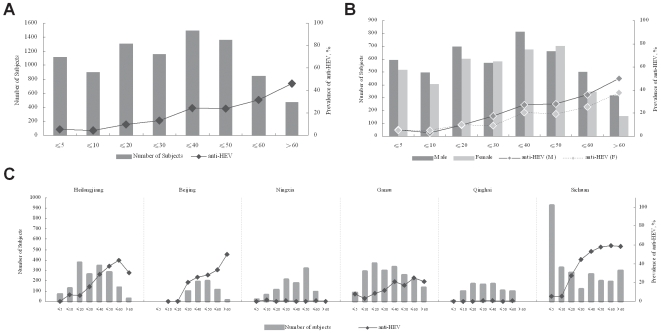
Figure 4. Serological features of anti-HEV prevalence in China.
Bars represent the number of subjects in each group indicated by left vertical axis, and the points represent the prevalence in each group indicated by right vertical axis. The horizontal axis represents the age ranges. A, Overall characterization of anti-HEV by age group. B, Overall characterization of anti-HEV by gender, M, male, F, female. C, Regional characterization of anti-HEV by age group.

