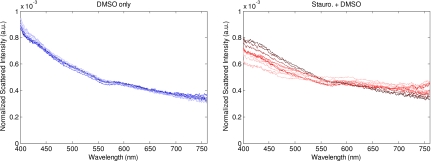
Figure 4.
The treated and untreated spectra from a representative trial of the apoptosis experiment plotted over time. Data plotted here are the same as in Fig. 3. Spectra from the untreated sample are plotted on the left, and those from the treated sample on the right. The early time points are represented in darker colors, whereas the later time points are lighter colors.

