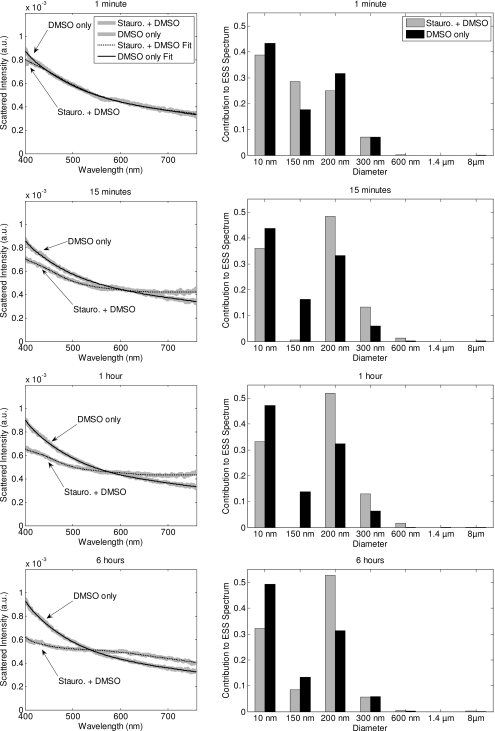
Figure 7.
A representative set of best-fit curves to the experimental data presented in Fig. 3 (left panel) and the resulting size distributions (right panel) for relevant time points. The size distributions of the sample treated with DMSO only remains relatively constant. In the staurosporine-treated sample, there is a progressive decrease in the contribution of both the Rayleigh and 150-nm scatterers, with a corresponding increase in contribution for the 200-nm scatterers in the 15-min through 6-h time points.

