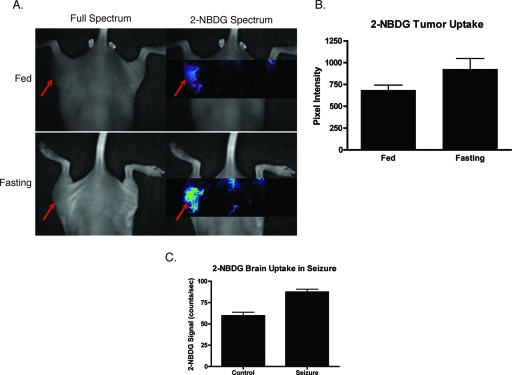
Figure 2.
Assessment of 2-NBDG as a marker of glucose metabolism in animals. (a) Multispectral fluorescence imaging of HT-29 subcutaneous tumors in nude mice 40 min following administration of 500 nmol of 2-NBDG in fed versus fasting states. Red arrows indicate the location of the tumor. There is a noticeable increase in 2-NBDG signal after the animal was kept NPO for 24 h. (b) Analysis of (n=4) animals with subcutaneous tumors imaged, while fed and fasting shows a statistically significant (p<0.05) increase in 2-NBDG uptake in fasting animals. (c) Statistically significant (p<0.05) increase in 2-NBDG signal in the brain of an animal experiencing generalized seizures induced by injection of pilocarpine i.p. versus control. These data suggest that 2-NBDG localization reflects true glucose utilization rather than nonspecific extravasation.

