Figure 3.
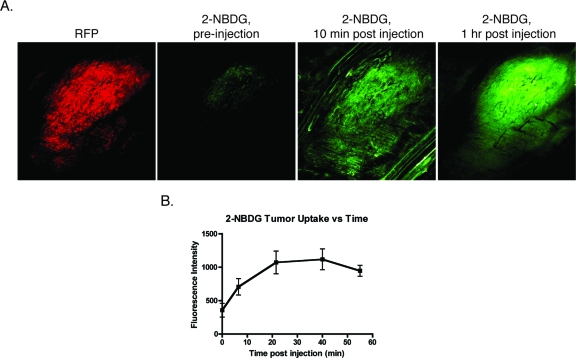
Intravital laser scanning fluorescent microscopy of an RFP-labeled 9-L gliosarcoma tumor implanted in a dorsal window chamber of a nude mouse. (a) The left-most image illustrates the location of the tumor based on its constitutive expression of RFP. The second left-most image shows the tumor autofluorescence in the 2-NBDG channel, and the subsequent images in the panel show accumulation of 2-NBDG in the tumor over time. By 60-min postinjection, the 2-NBDG signal correlates very well with the RFP signal. (b) A plot of the 2-NBDG signal intensity in the tumor over time shows that the molecule accumulates and reaches a steady plateau after approximately 20 min.

