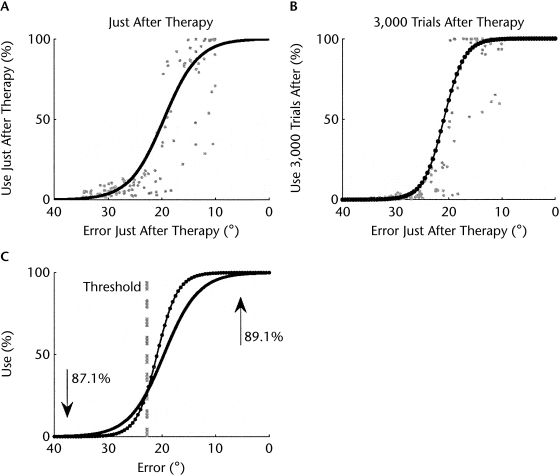
Figure 1.
Simulated data of use of the affected arm (A) just after therapy and (B) 3,000 trials after therapy as a function of performance (reach directional error in the model) just after therapy for 125 simulated subjects with different lesion sizes and locations. (C) Comparison of the sigmoidal fit of use just after therapy and 3,000 trials after therapy. The intersection of the 2 curves gives the threshold in arm performance above which use increases and below which use decreases. The upward arrow indicates that 89.1% of the simulated subjects above threshold showed increased arm use after therapy. The downward arrow indicates that 87.1% of the simulated subjects below threshold showed decreased arm use after therapy. Note that we reversed the x axis, to compare with the data of Figure 2.

