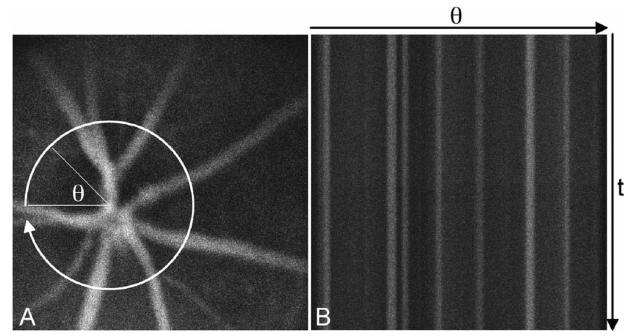
Fig. 2.
Confocal fluorescence image of mouse retinal vessels visualized with the fluorescent dye Evans Blue, A, with a cartoon of the circular retinal flow cytometer scan. Evans Blue has similar excitation and emission characteristics as DiD. Consecutive circular scans are mapped to straight horizontal lines in the retinal flow cytometer file, B. Thus retinal vessels appear as vertical, fluorescent structures.

